Debugging and Inspection
RDC uses the flux store pattern, making debugging straightforward as each change is traceable and descriptive.


Installation
Add the browser extension for chrome extension or firefox extension
DevToolsManager makes this work. This is part of the default managers for CacheProvider in dev mode. If you have custom managers, you'll need to ensure DevToolsManager is included.
Open dev tools
After installing and running your site, a new icon should appear in your location bar
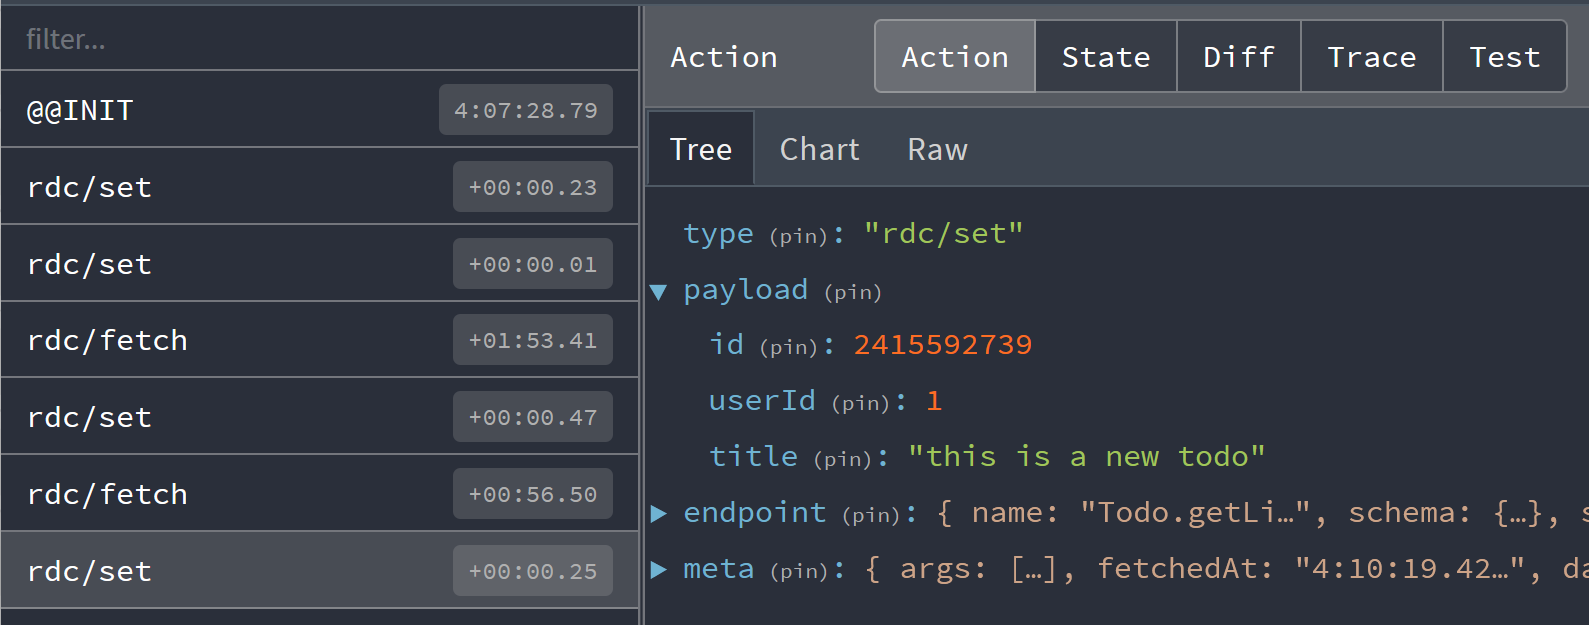
Clicking that will open the inspector, which allows you to observe dispatched actions, their effect on the cache state as well as current cache state.

The Controller dispatches actions, making that page useful for understanding what actions you see. Here we observe the most common actions of fetch and set.
By default the devtool integration will filter fetch actions initiated by hooks to reduce spam. This can be changed with skipLogging option.
State Inspection
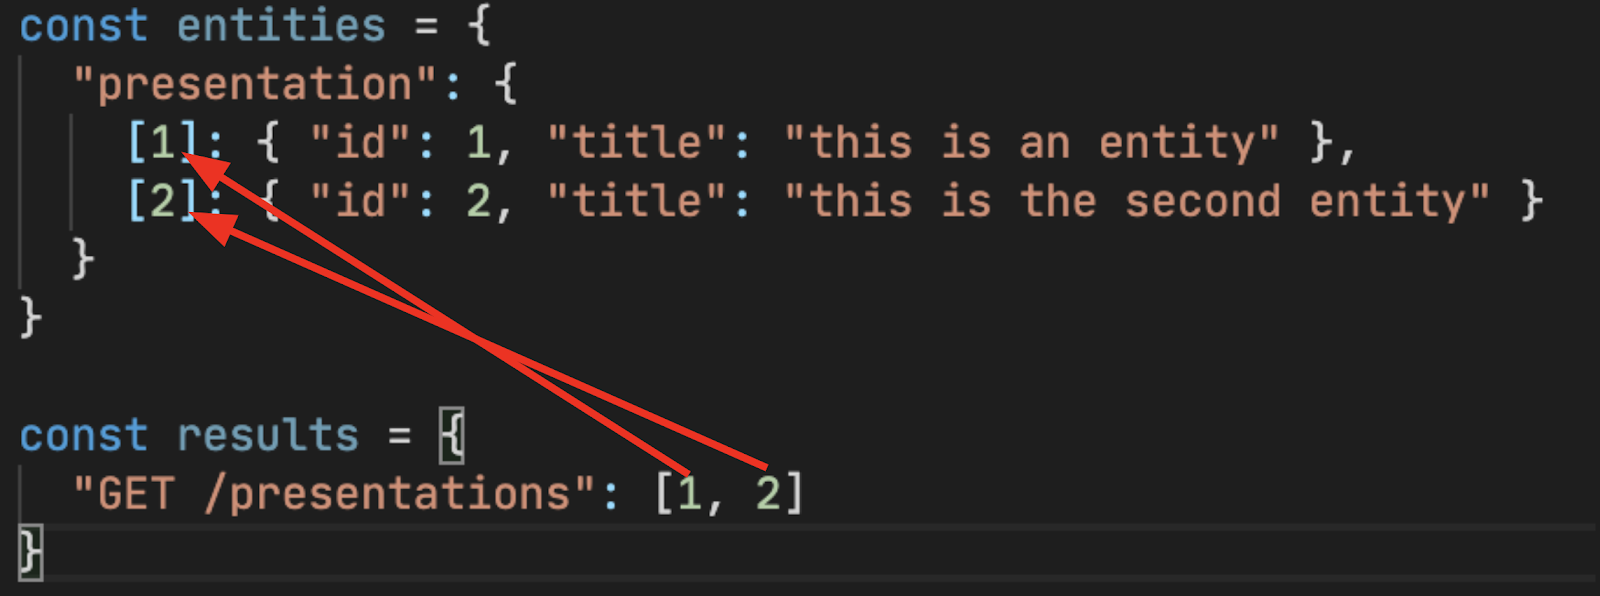
If schemas are used, API responses are split into two pieces - entities, and results. This is known as normalization, which ensures consistency and alows allows for automatic as well as novel performances optimizations, especially key if the data ever changes or is repeated.
- State
- Response
- Endpoint
- Entity
- React

[
  { "id": 1, "title": "this is an entity" },
  { "id": 2, "title": "this is the second entity" }
]
const getPresentations = new Endpoint(
  () => fetch(`/presentations`).then(res => res.json()),
  { schema: new schema.Collection([Presentation]) },
);
class Presentation extends Entity {
  id = '';
  title = '';

  pk() {
    return this.id;
  }
  static key = 'presentation';
}
export function PresentationsPage() {
  const presentation = useSuspense(getPresentations);
  return presentation.map(presentation => (
    <div key={presentation.pk()}>{presentation.title}</div>
  ));
}
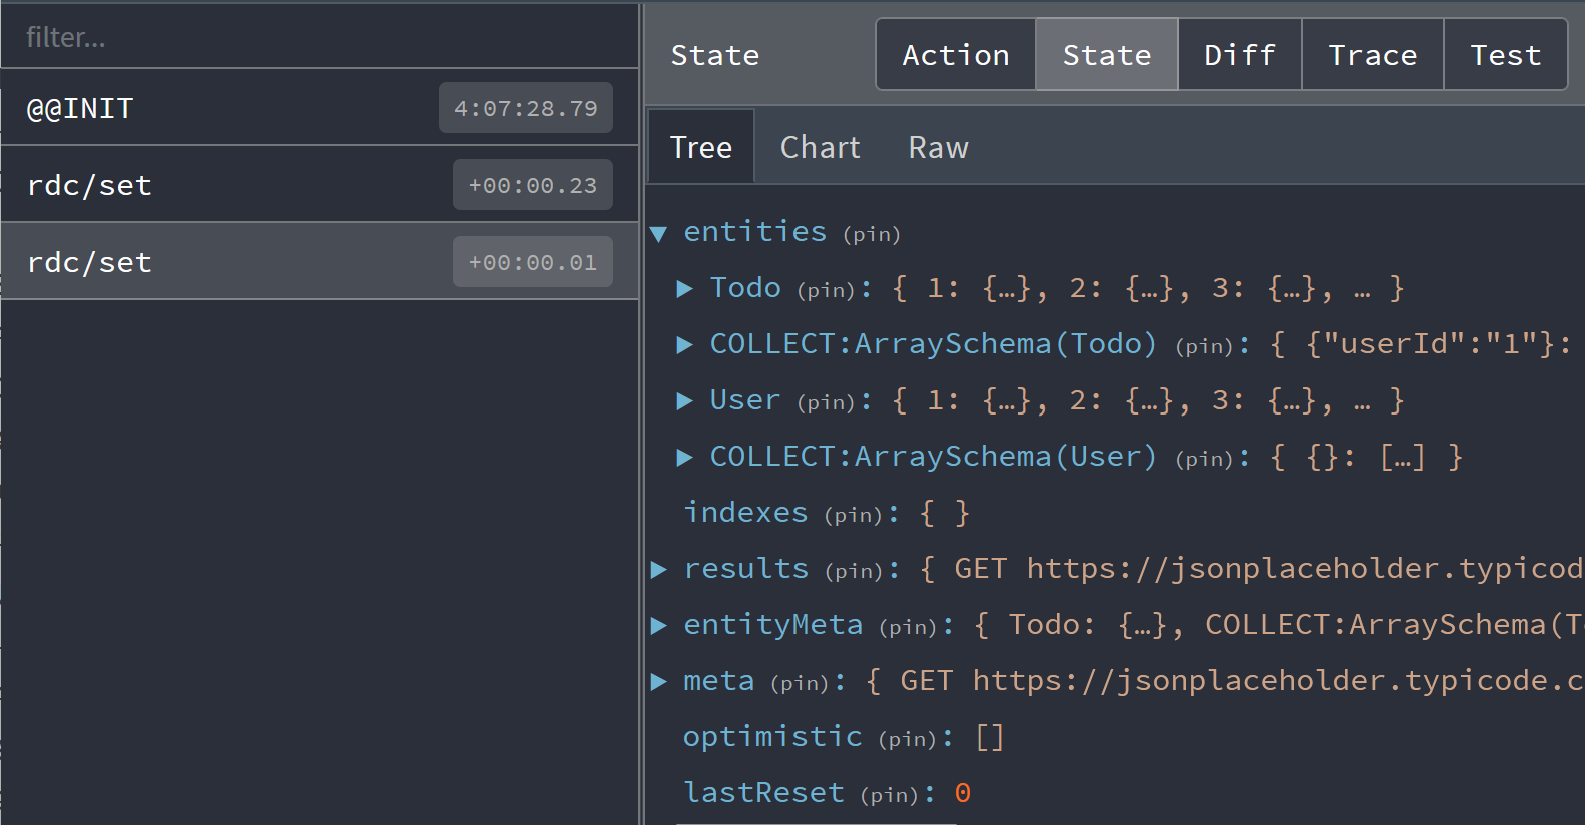
Once normalized, these entities and results are merged with the larger cache. Click on the 'state' tab in devtools to see the entire state. This can be useful to determine exactly where data is. There is also a 'meta' section of the cache for information like when the request took place (useful for TTL).

State Diff
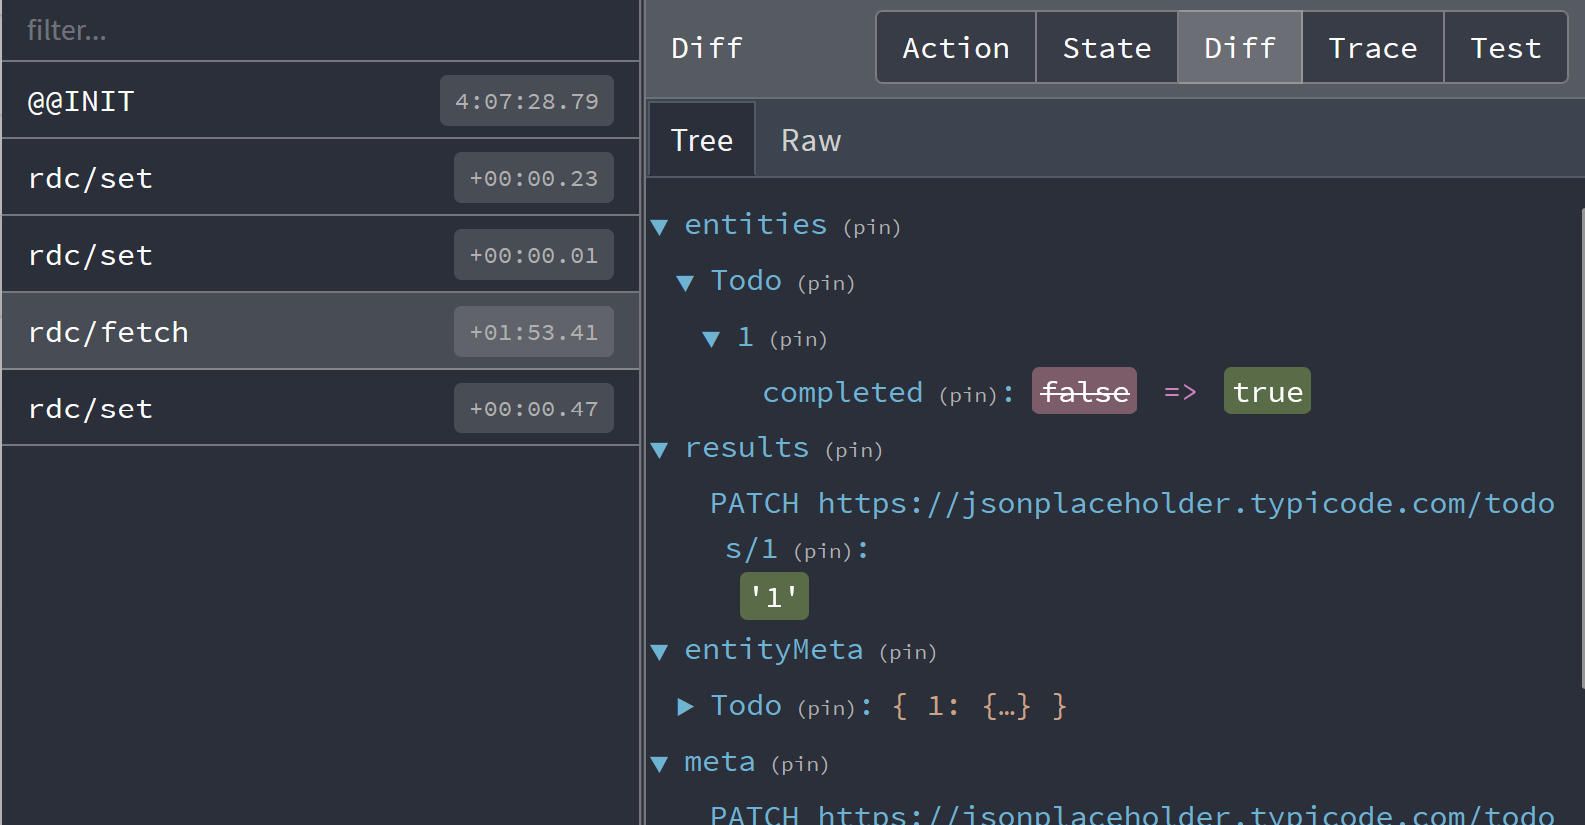
For monitoring a particular fetch response, it might be more useful to see how the cache state updates. Click on the 'Diff' tab to see what changed.

Here we toggled the 'completed' status of a todo using an optimistic update.
Action Tracing
Tracing is not enabled by default as it is very computationally expensive. However, it can be very useful
in tracking down where actions are dispatched from. Create your own DevToolsManager
with the trace option set to true:
import {
  DevToolsManager,
  CacheProvider,
  getDefaultManagers,
} from '@data-client/react';
import ReactDOM from 'react-dom';

const managers =
  process.env.NODE_ENV !== 'production'
    ? [
        new DevToolsManager({
          trace: true,
        }),
        ...getDefaultManagers().filter(
          manager => manager.constructor.name !== 'DevToolsManager',
        ),
      ]
    : getDefaultManagers();

ReactDOM.createRoot(document.body).render(
  <CacheProvider managers={managers}>
    <App />
  </CacheProvider>,
);